Energy Conservation
Smart Lighting – Intelligent lighting control using real-time occupancy data.
Abstract
The purpose of this project is to deploy a sensor network to obtain human occupancy data of an enclosed space and lay the groundwork for an algorithm to control the lighting for energy conservation. The idea is to create a smart space that is able to determine where the occupants are located inside a room and be able to “pinpoint” the lighting to ensure maximum efficiency for energy and lighting purposes. Currently, most commercial buildings statically light their rooms at the same levels throughout the day. With my solution I would be able to dynamically light rooms, where only portions that are occupied by people need to be illuminated, whereas the unoccupied portions may remain dark.
To conduct the data collection portion of this project, I will be working with sensors arranged in a grid-like matrix. Each square in my grid should be defaulted to inactive. When a sensor detects human presence in a certain square, that grid will be considered active. The resulting data will feed to the algorithm which will appropriately adjust the lighting. When a square is no longer occupied, the algorithm will adjust the lighting as the area.
Purpose/Objective
As of now in rooms around the world, there is energy that could potentially be saved. In this specific scenario, the energy I aim to save is electrical, as I want to efficiently luminate light bulbs in classrooms. I hope to implement on a small scale and efficient algorithm that can dynamically light Lucy Stone Hall. I will use the energy and power consumption analysis developed by the previous group, and couple that with the new sensors and wifi-shield that I bought to obtain a holistic and temporal data set. The sensors will be arrayed in a grid like manner to allow human occupancy detection to be done in a calculated and accurate manner. After this, I hope to develop an algorithm that can systematically identify users and efficiently output the proper lighting for each lightbulb, thus saving Rutgers the costs of lighting utility bills.
System Diagram
The sensor network is made up of Omron’s D6T MEMS Thermal sensors which collect temperature readings. The readings are collected in 16 distinct areas, arranged in a 4x4 grid like pattern. With the sensor acting as a focal point, it can read along the x-axis with a scope of 44.2° and along the y-axis with a scope of 45.7°. Consequently, the length of the x-direction is tan(44.2/2)*2*distance and the length of the y-direction is tan(45.7)*2*distance, where distance is equal to the distance from the backdrop. In the case of my system, the distance will be equal to the height of the ceiling where the sensors will be positioned. The individual sensors are powered by an Arduino Uno via an I2C connection. The I2C connection is designed to easily connect peripheral sensors via a two bi-directional open-drain lines, Serial Data Line (SDA) and Serial Clock Line (SCL).
After the Arduino reads the data from the sensor and converts the hex code into a relevant temperature reading it would WiFi to transmit the data to my online data analytics platform - ThingSpeak Channel. The Arduino connects to the WiFi using the WiFi 101 shield. In the attempt to connect to the WiFi network, the first approach was to try to connect to my university’s network, RUWireless_Secure. In order to connect to the university network, a computer was configured for the network with the Arduino’s MAC Address and other credentials. However, the university’s infrastructure does not authenticate via MAC address so that approach did not give the Arduino internet access. Next, a router was attempted to be set up as an access point, but unfortunately due to university regulations there can be no wireless broadcasting with routers. Finally, the solution that worked for the research was to create an access point via hotspot, tethering from a smartphone.
After the data is sent to the ThingSpeak channel, the platform would allow for a live data stream which can be fed into a Matlab program of our own design. During experiments the data was stored and analyzed after it was finished, however moving forward the API allows for the analysis of data real time. This program will be an algorithm designed to take in information about the occupancy positioning of the room, and be able to discern which areas need to be illuminated.
Required Hardware and Software Tools
he project requires the D6T thermal sensor, Arduino Uno, Arduino WiFi Shield, Bosch GLM 15 Laser Sensor, ThingSpeak API, Matlab, and/or Wi-Fi hotspot (optional).
6x D6T-44L-06 Thermal Sensor

The D6T Thermal Sensor which was widely used in this project to detect object between a temperature range of 0 to 50 degrees Celsius.
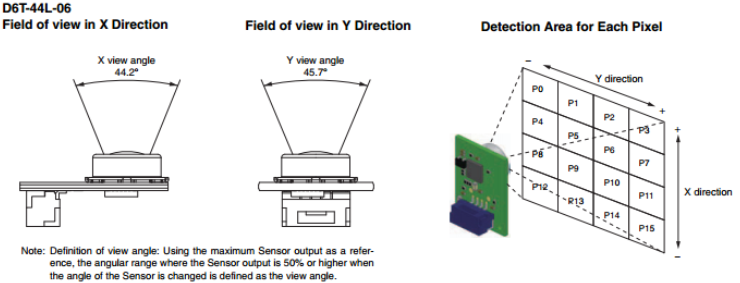
The D6T Sensor creates an 4 by 4 array which you can use to pinpoint exactly where the heat source is.
Arduino Uno
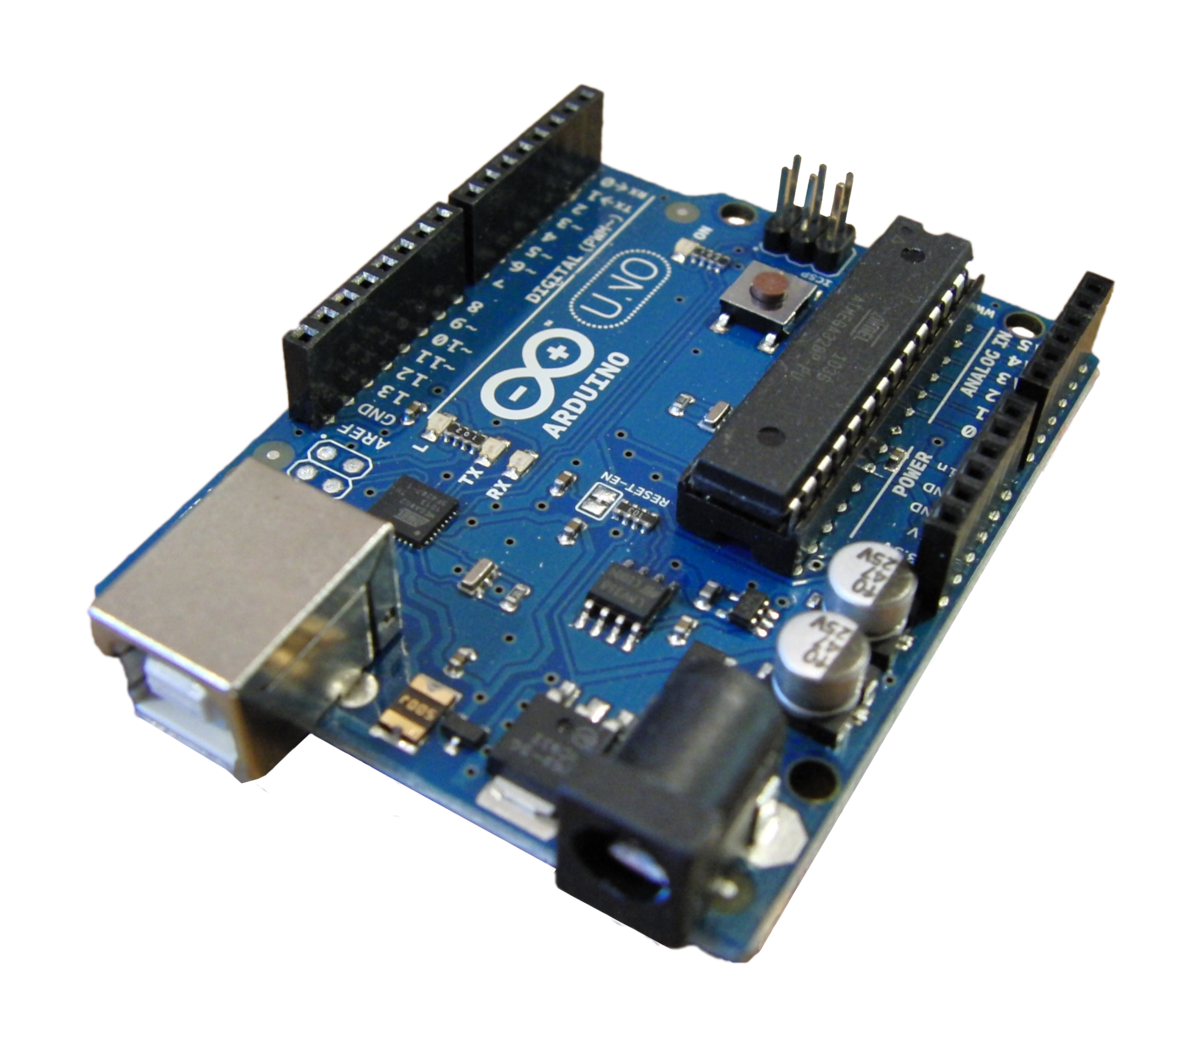
The Arduino Uno, listed in Figure 3, is a microcontroller board with 14 Digital I/O pins that can connect to a computer with a USB cable or be powered with a AC-to-DC adapter/battery.
Arduino Wifi Shield 101
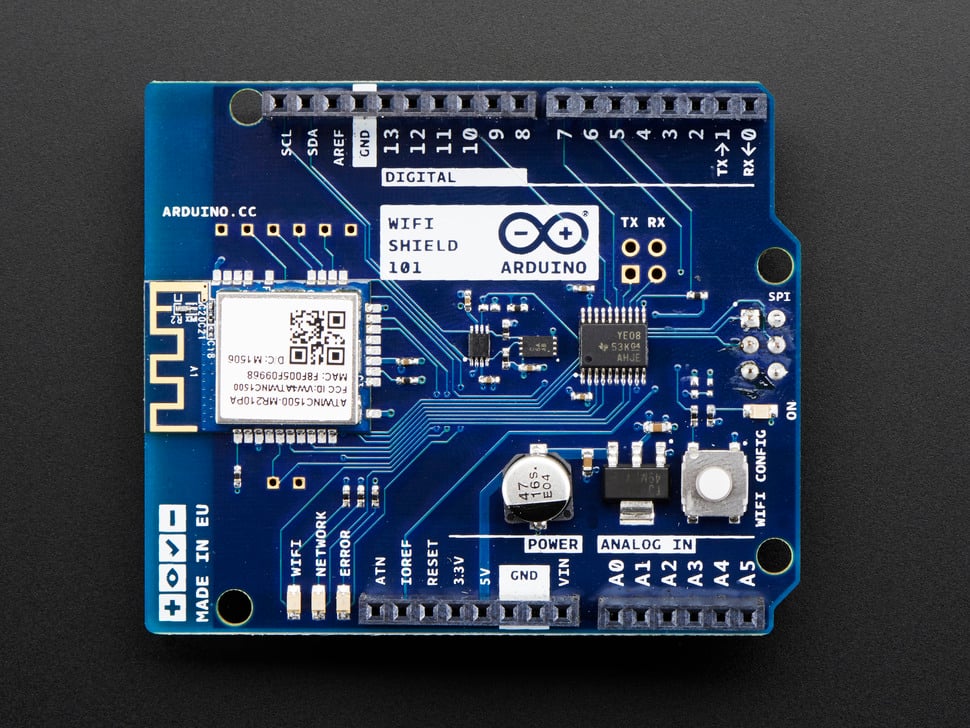
The Arduino WiFi Shield 101 connects the Arduino board to the internet wirelessly and comes with a shield with crypto-authentication. The WiFi shield was used to relay data back from my sensor to my ThingSpeak API.
Bosch GLM 15 Laser Measure

The Bosch GLM 15 Laser Measure is a precise laser that measures up to 50th with accuracy to ⅛”. I used this laser in CORE Room 538 to get accurate room measurements, and set up my grid to place sensors during the experimentation phase.
Software
ThingSpeak

ThingSpeak API is a real-time data collection and storage application that I used to connect to my Arduino to analyze the data.
Experiment/Product Results
Each sensor module encodes the temperature data as a 16 bit-width signed value that is 10 times the actual temperature in degrees celsius. I first must decode the data to fahrenheit. Below is a preliminary example of an actual temperature measurement, formatted to display the appropriate data. After discussing this example, there will have a more wholesome understanding of the actual results from my live experiment data in CORE 538.
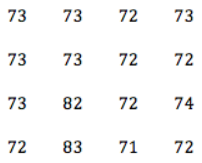
As you can see, there are 16 distinct temperature readings arranged in a 4x4 grid. This reading was taken directed towards a human standing approximately 15 feet away. Following the formula above, the sensor would be able to capture a grid of a total x-length of tan(44.2/2)*2*15 = 12.18 feet and y-length of tan(45.7)*2*15 = 12.64 feet. Consequently, each box is 3.05 ft. x 3.16 ft. Following this, it is easy to extrapolate from the image above that person is standing in frames P10 and P14 if you follow the naming convention shown below.

In this example the room temperature is approximately 72° F. In general, it has found humans to register at temperatures above 80° F. My system will assume that readings above 80° are human. It is possible that other objects (food, drinks, and electronic devices for example) would register as this, but that is unavoidable. My algorithm would have to establish a baseline average temperature to approximate the room’s actual temperature to best identify people.
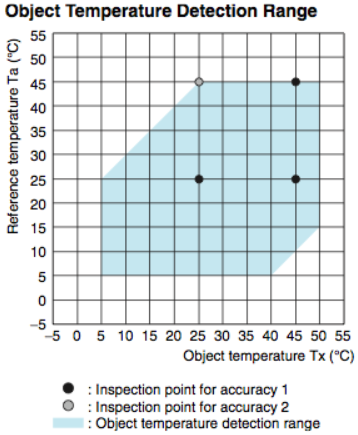
The manufacturer of the sensor provided the graphic below. At room temperature (21 ° C), the thermal sensor will accurately identify temperatures within the range of 5°-50° C, well within a typical humans range, around 27 ° C.
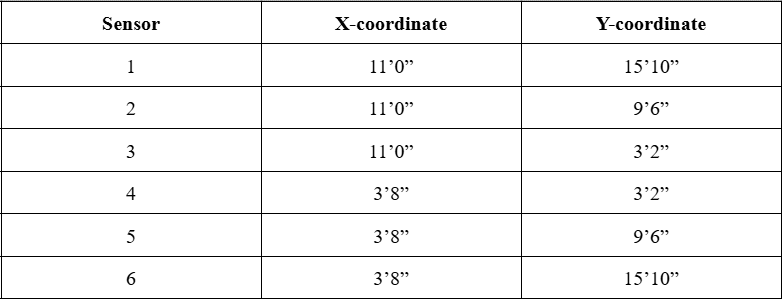
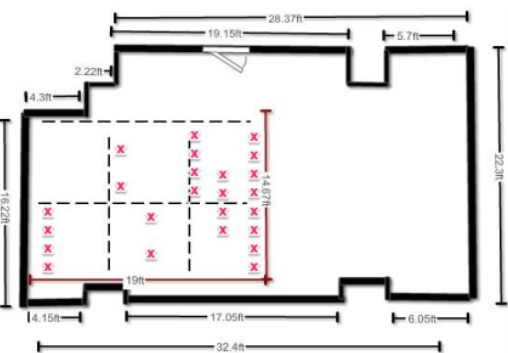
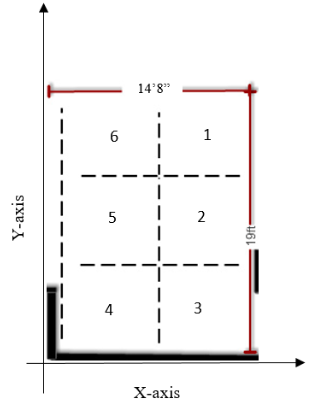
For my experiment, I deployed a sensor network of 6 nodes in a classroom CORE 538 and created a 96 point grid to detect human presence. In Figure 9, I used the Bosch GLM 15 Laser Measure to create a blueprint of the classroom. Within the grid, the “x” indicates where my research subjects are sitting. To determine exactly where my sensors should be located, I measured out the room creating an X-axis of length 14.67 feet, and Y-axis of 19 ft and from there determined which points in the grid would be the exact center.
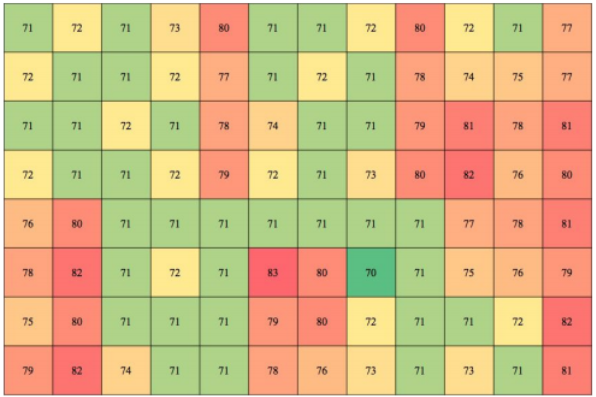
This is a heat map of the average temperature corresponding to the distribution of people. Note the average room temperature is approximately 71°. All temperatures above 76° indicates a person inside the grid. Temperatures higher than this threshold are positively correlated with increased surface area captured by the sensor. If you compare Figure 9 to Figure 11 you can easily see that the sensors we deployed can accurately detect residual human movement. This is because all the location marked with x’s to display humans have a temperature higher than 79 degrees Fahrenheit.
Environmental Impact
The impact of such a system being integrated in a large portion of lighting systems is substantial. The EPA estimates that 31% of all greenhouse gas emissions were emitted to produce electricity. Lowering electricity consumption will in turn reduce greenhouse gas emissions. In 2014, The United States consumed approximately 412 billion kilowatt hours of electricity just for the purpose of lighting the residential and commercial sections of the country. Furthermore, more than 52 billion kWh of this figure was used to lite specifically the manufacturing industry, which is largely self automated and housed in large facilities. The reason I wish to deploy our system in Lucy Stone Auditorium is because it is a relatively large room, with a high traffic of people entering in and out. However, for much of the day, a large portion of the auditorium is unoccupied. Translating this principle to industry, this energy conservation system would be most impactful in manufacturing, which equates to 1.3% of total electrical consumption in the country.
Social Impact
When discussing the social impact of such a system, it is important to note that it is completely passive in nature, that is to say that once implemented it requires no human interaction other than maintenance. Building upon this premise, a dynamic lighting system should not in fact change how people behave or move around in buildings. The occupants must be able to move freely, unhindered as to ensure satisfaction with the system.
A dynamic lighting system can be installed and benefit many locations. Any public building, large warehouse, manufacturing facility etc. While this system will change how electricity is consumed, it will not have a significant adverse effect on employment. While static lighting systems do require manual adjustments to the system, this job is not the sole responsibility of an employee and would not make their position extraneous.
A dynamic lighting system would also need to take measures to ensure that the safety of people is guaranteed. For example if one were to be walking into an unoccupied portion of a room, which would be dark, it is important that they themselves at any given moment be forced to move into an unlit portion before the system could adjust. For that reason, the system must ensure it illuminates a certain distance around an occupied area. The algorithm must take this fact into consideration and responsibility account for it.
The D6T sensor system I created allows for accurate and live data that can do one, if not the most important step in this dynamic lighting system, which is to collect accurate data. Sustainability consideration and constraints includes economic, environmental, and social (equity) aspects that need to be evaluated and taken into account in project research and development. There is a strong relationship between these three pillars of sustainability. These need to be considered and incorporated in this section with a discussion on their design constraint and the positive and negative effects of the project within this scope.
Conclusions / Summary
All in all, the lighting system Lutron will install will help Rutgers be more energy efficient and save money throughout the year in the future. This basis set for the new system will be a solid addition to Lucy Stone Hall, as the current lighting system has not been updated since its inception. My main goal was to create robust and accurate sensors that could detect human presence in a dynamic setting.
To summarize my process, I set up a grid like area with the D6T thermal sensor and relayed live data using a Wifi Arduino Shield. Next, I asked for test subjects to come to a room to test the accuracy of my sensor grid. I analyzed this data using the ThingSpeak API to confirm whether or not these sensors can precisely detect human occupation in a certain area. I can not only log data using the D6T, but connect it to the wifi as well to accurately detect human presence. The next leg of this research will move onto the data analytics and algorithm development portion. Once this algorithm has been implemented, Rutgers will have successfully created a system that has the potential to be applied to not only Lucy Stone Hall but on a much larger scale. Therefore, I have set the initial building blocks, for the next person/persons to program an energy efficient dynamic lighting algorithm.